logo

Geohistoriography

Tuesday 10 March 2009
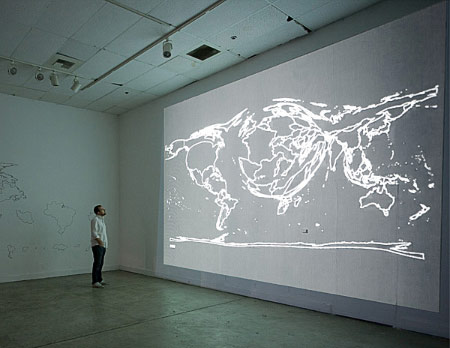
Artist Tim Schwartz illustrates on his website his installation piece Geohistoriography.
This show captures how America views the world as seen through the lens of the American media. All data was collected from the New York Times, namely the number of articles written about a certain country for each year.

The two wall drawings are representations of the 2008 state of America’s view of the world. In one piece countries were morphed and expanded or contracted if they were written about more or less than average. In the pyramid piece, countries were organized in a ranked fashion depending on this same data.

The animation shows how America’s perspective changed over the last 150 years.

filed under History

comment on this article by private email

Search marquis-kyle.com.au

Serendipity
Imagining large numbers
$87,000,000,000.00
Headcounting at Camp Delta
Running the numbers

Monthly archive
2021 A
2020 O A J J M A M F J
2019 D A J
2018 O S A J J M A M F J
2017 D N O S A J J M A M F J
2016 D N O S A J J M A M F J
2015 D N O S A J J M A M F J
2014 D N O S A J J M A M F J
2013 D N O S A J J M A M F J
2012 D N O S A J J M A M F J
2011 D N O S A J J M A M F J
2010 D N O S A J J M A M F J
2009 D N O S A J J M A M F J
2008 D N O S A J J M A M F J
2007 D N O S A J J M A M F J
2006 D N O S A J J M A M F J
2005 D N O S A J J M A M F J
2004 D N O S A J J M A M F J
2003 D N O S A J J M A M F J
2002 D N O S A J J M A M F J
2001 D N

Subject archive
Archaeology
Architecture
Collecting
Conservation
Design
Environment
Food
History
Lighthouses
Maps
Me
Photography
Prints
Ratbags
Reviews
Society
Technology
The web
This site
Tools
Typography
Words

About marking time

RSS

©
Contact me